Ever wondered why Oregon’s population is spread out the way it is, or how the mountains and valleys affect the economy? This article dives into the intricate connection between geography, people, and the economy in Oregon and Washington. We’ll explore everything from the fertile Willamette Valley to the arid high desert of eastern Oregon, illustrating how the landscape shapes activities ranging from agriculture to business. Using maps, real-world data, and expert insights, we’ll enhance your understanding of these states and even propose ideas for informed land use and economic development strategies. Prepare to uncover the hidden story of how land, people, and prosperity intertwine in Oregon and Washington! For a detailed visual, check out this [Oregon & Washington map](https://www.lolaapp.com/oregon-washington-map/).
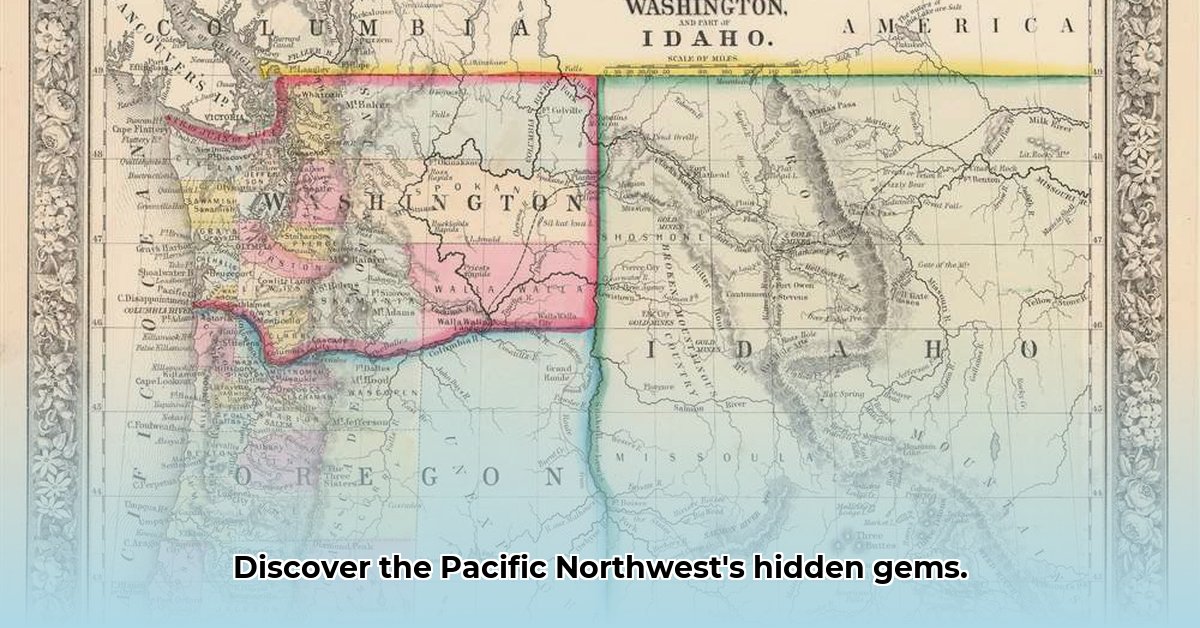
Map of Oregon and Washington: Unveiling the Pacific Northwest’s Hidden Stories & Regional Dynamics
Let’s explore the Pacific Northwest and its distinctive regional dynamics! Oregon and Washington, neighboring states that share a stunning coastline and remarkably diverse landscape, present a captivating case study of how geography molds a region’s identity—economically, socially, and culturally. A detailed map of Oregon and Washington is essential to unlocking this complexity, offering key insights into population density and patterns of economic activity. It serves as a roadmap to understanding the very pulse of this region, highlighting everything from thriving agricultural regions to bustling urban centers.
Oregon: A State of Contrasts and Diverse Terrains
Oregon is a state characterized by dramatic contrasts and diverse terrains. Imagine this: crashing waves sculpting the rugged sea cliffs along the Pacific coast transitioning quickly to the arid expanse of the high desert just a short drive inland. This remarkable variety profoundly influences how people live and work, fostering unique regional economies.
The Willamette Valley exemplifies this, as a lush, fertile area where agriculture thrives. Farming is the dominant force here, supporting robust crop production and driving a prosperous agricultural economy. As a result, this fertile region is also the most densely populated area of Oregon. The landscape is dotted with bustling farm towns, thriving communities, and a high concentration of residents. This contrasts sharply with eastern Oregon, where the landscape transforms into sprawling ranches and vast forests. There, ranching, logging, and other resource-based industries form the economic backbone, leading to a more dispersed population. A map vividly illustrates these differences, revealing distinct population clusters and the expansive open spaces in between, which significantly impacts rural development strategies.
Economic Echoes of the Land and Regional Job Markets
There’s a strong, direct correlation between Oregon’s economy and its geography, deeply influencing regional job markets and opportunities. The Willamette Valley’s fertile soil bolsters a powerful agricultural industry, while eastern Oregon’s abundant resources fuel its timber and ranching sectors. However, a comprehensive understanding of job markets and economic growth requires a deeper exploration. How do these varied economies interact and support one another? What are the opportunities to strengthen the connections between them and foster collaboration? These are the types of questions a map of Oregon and Washington can help address, driving informed economic growth. This level of understanding is crucial for local leaders engaged in strategic planning and for businesses seeking to expand within the region. For example, this detailed economic knowledge allows businesses to precisely target their strategies to align with regional nuances.
Where Do People Call Home and Population Distribution
Population distribution in Oregon directly reflects its geography and economy, significantly influencing community planning initiatives and resource allocation. Higher population densities in areas like Portland and the Willamette Valley are a direct result of fertile land and abundant job opportunities in agriculture and related industries. Conversely, eastern Oregon presents a different demographic picture. The region’s harsher climate and the distinct opportunities presented by the land’s capabilities mean fewer residents. This demonstrates a fascinating interplay of factors, which a detailed map helps visualize, illustrating the relationship between where people live and why, which profoundly shapes infrastructure development.
What We Still Don’t Know: Data and Research
While a significant amount of data is readily available about Oregon—sourced from government entities and various online resources—there are still critical knowledge gaps that need to be addressed through further research and analysis. More focused research is particularly vital for understanding the specific economic conditions in the less populated eastern Oregon. Gathering more detailed and granular data on employment rates, industry diversification, and other vital economic indicators would paint a more complete and nuanced picture of the region. As research efforts continue, improved data quality and availability could lead to a more thorough understanding of how regional economies function and interact, ultimately enhancing the scope of economic analysis.
Putting Knowledge to Work: Land Use Practices
This geographic knowledge isn’t just for academic exploration; it’s essential for real-world action and improved land use practices that benefit the environment and the economy. Land managers require access to the most current and accurate data, particularly concerning eastern Oregon, to enhance land use practices and ensure sustainability. Regional planners can utilize this information to design more effective infrastructure and support sustainable development initiatives. Businesses can leverage this geographically specific information to target markets and identify investment opportunities with greater precision. Effective use of a map of Oregon and Washington is crucial for smart growth and sustainable economic development throughout the state, fostering sustainable development for future generations.
Across the Border: Exploring Washington State and Urban Development
Now let’s consider Washington and the complexities of urban development. The state shares similar geographic characteristics with Oregon, boasting a diverse landscape ranging from a stunning coastline to mountainous regions and fertile valleys. However, key differences exist. Washington’s population distribution is heavily influenced by major metropolitan areas like Seattle and Spokane, creating distinct population centers that contrast with Oregon’s more dispersed development pattern, particularly in the eastern region. Comparing maps of Oregon and Washington reveals that even seemingly similar geographic landscapes can lead to very different economic and population patterns. Further study and more detailed analysis could provide valuable insights into long-term regional development trajectories for both states, enhancing long-term planning and collaboration.
| Stakeholder Group | Short-Term Actions (0-1 year) | Long-Term Goals (3-5 years) |
|---|---|---|
| Land Management Agencies | Improve data accessibility; prioritize data collection and analysis for eastern Oregon and rural Washington. | Develop sustainable land management strategies that account for the predicted impacts of climate change and promote resilient ecosystems. |
| Regional Planners | Integrate comprehensive geographic data into all development plans across both states to ensure informed and sustainable growth. | Implement sustainable infrastructure projects that navigate the varied terrains of Oregon and Washington. |
| Businesses | Actively identify region-specific economic opportunities and develop diversified marketing strategies tailored to local contexts. | Promote diversification of economic bases in less populated regions by exploring and leveraging regional synergies and fostering entrepreneurship. |
| Researchers | Conduct in-depth data collection and analysis to enhance the available economic data for eastern Oregon and Washington. | Develop predictive models to forecast economic trends and population shifts based on geographic and socioeconomic data to aid in long-term strategic planning. |
Using a map of Oregon and Washington is more than just looking at geographical features; it’s about unlocking opportunities for businesses, enabling informed land management practices, and shaping sustainable regional growth, all of which drives collaborative regional partnerships. This involves a deep understanding of the rich stories woven into the very landscape of the Pacific Northwest.
How to Analyze Oregon’s Regional Economic Disparities Based on Geographic Features & GIS Data
Oregon’s economy is far from uniform. Significant disparities exist across its diverse regions. Gaining a true understanding of these disparities requires analysis through a geographical lens, specifically utilizing GIS data. Let’s explore how geography and location impact prosperity, examining economic inequality across the state with expert precision.
Urban vs. Rural: A Tale of Two Oregons & Resource Allocation
The most prominent disparity is the longstanding urban-rural divide, including significant issues pertaining to resource allocation. Thriving metropolitan areas like Portland and Bend boast robust economies, high employment rates, and higher median incomes compared to their rural counterparts. These differences have become deeply rooted over time due to historical development patterns. Access to resources, diverse job opportunities, and robust infrastructure are key factors driving this divide.
However, the situation is more nuanced than just urban and rural. Even within urban areas such as Portland, stark economic contrasts exist between neighborhoods and communities.
The Portland Paradox: Prosperity and Poverty Side-by-Side & Housing Disparities
East Portland, surprisingly, demonstrates higher child poverty rates, exceeding 25%, surpassing the state average of 14% and the national average of 16%. This illustrates that even in thriving cities, deep pockets of disadvantage exist, often exacerbated by significant housing disparities. This complex issue stems from factors such as historical segregation practices, unequal access to quality education and employment opportunities, and pervasive affordable housing shortages. The process of how to analyze Oregon’s regional economic disparities based on geographic features needs to move beyond simple urban/rural distinctions and consider other factors. A finer-grained approach is essential, incorporating detailed socioeconomic data to pinpoint specific issues.
The Remote Work Revolution: A Double-Edged Sword? & Technological Advancement
The surge of remote work has introduced another layer of complexity, profoundly influencing the landscape of technological advancement and its impact on regional economies. While remote work might initially seem like a universally beneficial trend, the reality is far more nuanced. Portland has witnessed a significant influx of remote workers, generating economic activity and contributing to local businesses. However, these benefits have not necessarily translated into comparable advantages for rural communities, nor have the gains been equally distributed across various segments of the population. Individuals with existing access