Want to understand the intricate dynamics of our oceans? The World Ocean Atlas (WOA) serves as a comprehensive, meticulously detailed map of the marine environment, containing essential data on temperature, salinity (salt concentration), oxygen, and nutrients. For more on water resource management, see this helpful resource: water management. This article delves into the latest version of the WOA, illustrating how scientists utilize this powerful tool to decipher changes in our oceans. We’ll assess its strengths, acknowledge its limitations, and explore its diverse applications, ranging from climate change studies to marine life conservation and resource management. Prepare to explore fascinating insights into the ocean’s health trends!
World Ocean Atlas: Decoding Our Oceans’ Health in 2023
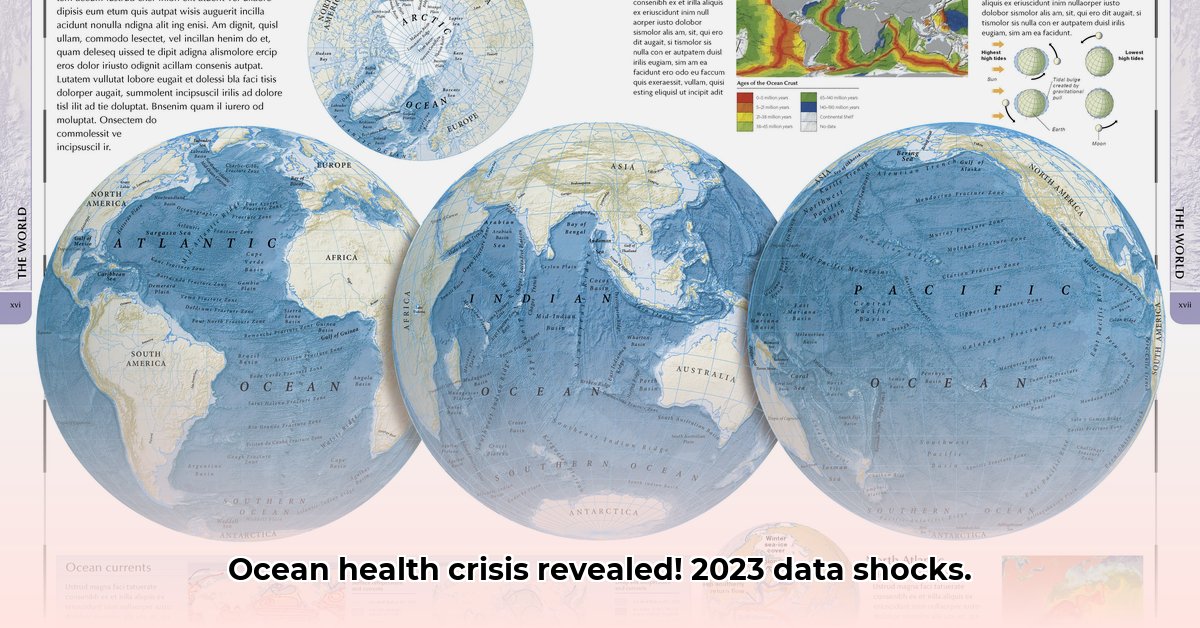
The World Ocean Atlas (WOA) is more than just a collection of numerical data; it’s a dynamic representation of our planet’s oceans. It’s a continuously updated encyclopedia that tracks essential indicators like water temperature, salinity, and oxygen levels, providing valuable insights into ocean health and marine ecosystems. The WOA provides a baseline that helps researchers determine whether current observations are within the statistical norm within the context of a 30-year climatological background. Think of it as a living document, constantly adapting to new data and advancements in oceanographic science.
The World Ocean Atlas: A Growing Story
The WOA has undergone significant evolution to become the detailed resource it is today. Each subsequent version – WOA01, WOA05, WOA09, WOA13, WOA18, and the newest WOA23 – builds upon its predecessor, incorporating more data and advanced methodologies. This continuous improvement provides a more accurate and detailed understanding of the ocean’s ever-changing state. The inclusion of data from the World Ocean Database(WOD) and Argo floats (robotic ocean probes) has dramatically improved the global picture, offering unparalleled resolution in real-time ocean observation. However, even with these advancements, inherent limitations remain a crucial consideration for interpreting oceanographic data.
The Challenges of Ocean Data: A Realistic View
While the WOA strives for accuracy, limitations are inevitable. Earlier data collection methods were less consistent than modern technologies. The contrast between manual sampling techniques of the past and automated readings of today introduces potential biases. The sheer volume of diverse data also presents challenges in data quality control and maintaining consistency across multiple sources. Researchers continuously work to address these issues and assess the significance of potential biases, contributing to a more robust understanding of oceanographic data.
Understanding the Source: Where Does This Data Come From?
The WOA integrates information from various sources: traditional water samples collected from ships, Conductivity-Temperature-Depth (CTD) instruments (underwater sensors), and the Argo float network. Each method presents unique advantages and disadvantages. Understanding the origins and methodologies of data collection is crucial for proper interpretation of the WOA’s data and its application in conservation efforts. The World Ocean Database (WOD) is the largest collection of uniformly formatted, quality-controlled, publicly available ocean profile data used by the WOA.
What Can We Do with the World Ocean Atlas?
The WOA is a valuable resource with many applications in marine research. Ocean scientists utilize it for various investigations, including climate model validation and refinement, while policymakers rely on it for informed decision-making in marine conservation and resource management. The enhanced accuracy and detail within the WOA have improved our ability to predict effects of climate change, aiding in informed decisions about the ocean’s future and mitigation strategies. The WOA can be used to create boundary and/or initial conditions for a variety of ocean models, to verify numerical simulations of the ocean, and corroborate satellite data.
The Future of Ocean Monitoring: Looking Ahead
The ongoing development of the WOA demonstrates a commitment to continuous improvement and scientific advancement. Scientists continuously improve data collection and analysis methods, incorporating innovative technologies to obtain more comprehensive datasets. The future of the WOA is promising, as it is poised to remain a crucial tool for understanding and protecting our oceans and marine environments.
How to Use the World Ocean Atlas: A Practical Guide
To effectively utilize this valuable resource, consider the following steps:
Define your research question: Clearly identify the specific ocean information required, such as temperature trends, salinity levels, or oxygen concentrations at specific depths or locations.
Access the relevant WOA data: Obtain the necessary data through NOAA’s website and data access tools. Data is presented in formats such as ASCII, CSV, ArcGIS compatible, and netCDF.
Understand the data format and limitations: Familiarize yourself with the structure and constraints of the data, including spatial and temporal resolution, and potential biases.
Analyze the data: Employ appropriate analytical methods, recognizing potential biases, and integrate with other datasets.
Interpret your findings: Analyze your results within the broader context of the ocean and climate change, acknowledging the limitations of the data.
Weighing the Pros and Cons: A Balanced Perspective
Feature
Strengths
Weaknesses
Geographic Coverage
Vast global coverage, particularly with Argo float data.
Limited in certain regions or at specific depths, like the deep ocean.
Data Resolution
Increasingly high resolution in both space and time.
Older data may possess lower resolution.
Parameters Measured
Measures temperature, salinity, oxygen, nutrients and more.
Potential inaccuracies in older datasets, especially for dissolved oxygen.
Data Accessibility
Freely available online, facilitating access for marine research.
Requires understanding of the data format to leverage fully.
The World Ocean Atlas provides an unparalleled view into the state of our oceans. By understanding its strengths and limitations, we can unlock its full potential to better understand and protect our planet’s precious waters. How can data resolution be improved in areas with low geographic coverage?
How to Mitigate Biases in NOAA’s World Ocean Atlas Dissolved Oxygen Data
Key Takeaways:
The World Ocean Atlas (WOA) is a valuable resource for oceanographic data, but awareness of its limitations is crucial for effective data utilization.
Data coverage varies significantly across geographic regions and time periods, particularly in polar regions and the deep ocean.
Measurement methods and quality control procedures differ across data sources, which impacts the consistency of the data.
Algorithmic changes between WOA versions necessitate careful consideration, particularly for dissolved oxygen data.
Addressing these biases requires improved data collection, refined quality control, and advanced data assimilation techniques.
Understanding WOA Dissolved Oxygen Data: Strengths and Weaknesses
The World Ocean Atlas (WOA) provides a wealth of oceanographic data, including crucial dissolved oxygen levels. However, the data isn’t perfect; biases exist, influenced by factors such as sensor calibration and data processing techniques. Let’s explore these issues.
One significant challenge is inconsistent data coverage. Some areas, particularly polar regions and deeper waters, have fewer measurements, leading to inaccurate representations in those undersampled regions.
Another issue stems from the diverse sources of data. Measurements come from various instruments (CTDs, XBTs, floats), each with its own strengths and weaknesses.
Moreover, changes in algorithms between versions of the WOA (for example, the shift from WOA23 v1.0 to v1.1) have introduced subtle alterations to the oxygen data adjustments. The precise effect of these alterations is still being evaluated. This emphasizes the need for ongoing scrutiny and validation of the data. How can the scientific community ensure thorough validation of oceanographic data to mitigate biases effectively?
How to Mitigate Biases in NOAA’s World Ocean Atlas Dissolved Oxygen Data
Addressing biases in WOA dissolved oxygen data requires a multi-pronged approach. Here’s how we can improve the quality and reliability of this essential dataset:
Enhance Data Collection: Expand observation efforts in undersampled regions, especially in deep ocean areas and polar regions.
Improve Data Quality Control: Implement standardized quality control procedures by harmonizing different data acquisition and processing methods.
Refine Data Assimilation Techniques: Develop sophisticated algorithms that better handle the diverse and potentially conflicting data, accounting for known biases.
Transparency and Openness: NOAA’s ongoing efforts towards data transparency are crucial, publicly documenting methodological changes and the rationale behind them.
Community Engagement: Collaborate with the broader oceanographic community by sharing data, methodologies, and best practices.
The Future of WOA Dissolved Oxygen Data
The WOA represents a colossal undertaking, providing invaluable insights into our changing oceans. While existing biases present challenges, the ongoing effort to address those biases is vital. By implementing the strategies above—enhancing data collection, standardizing quality control, improving data assimilation, increasing transparency, and encouraging community involvement—we can ensure the WOA remains a reliable and crucial resource. Additionally, the incorporation of data from initiatives like the Global Ocean Observing System (GOOS) can further enhance the comprehensiveness and accuracy of the WOA.
Proven Tactics For Utilizing World Ocean Atlas Data In Resource Management
Key Takeaways:
The World Ocean Atlas (WOA) has evolved significantly, improving data quality and accessibility over time through iterative refinements and technological advancements.
Despite improvements, challenges remain in data consistency and bias mitigation, necessitating a nuanced understanding of these limitations.
Proven Tactics For Utilizing World Ocean Atlas Data In Resource Management involve leveraging the WOA’s detailed oceanographic parameters for diverse applications in research, climate modeling, environmental monitoring, and resource management.
Hello, My love for writing is rivaled only by my passion for in-depth research. While many may skim the surface, I dive deep, seeking the hidden gems of information that give a story texture and depth. Every word I write is backed by hours of exploration, ensuring that my work is not just compelling, but also meticulously accurate. Join me on a journey where every piece is a deep dive into the realms of knowledge and storytelling.