Cryptocurrency investing can be a rollercoaster! The Crypto Fear & Greed Index is like a market mood ring, revealing whether investors feel optimistic or panicked. This guide explains how the index works, what to look for, and how to use it for smarter investment decisions. We’ll cover calculation methods, strengths, weaknesses, and how to combine it with other tools to navigate the crypto world’s volatility and potentially boost returns. Whether you’re a seasoned crypto investor or a beginner, this guide will help you understand and leverage the live Crypto Fear & Greed Index to your advantage. For real-time crypto quotes, check out live crypto quotes.
Crypto Fear and Greed Index Live: Navigating Market Sentiment
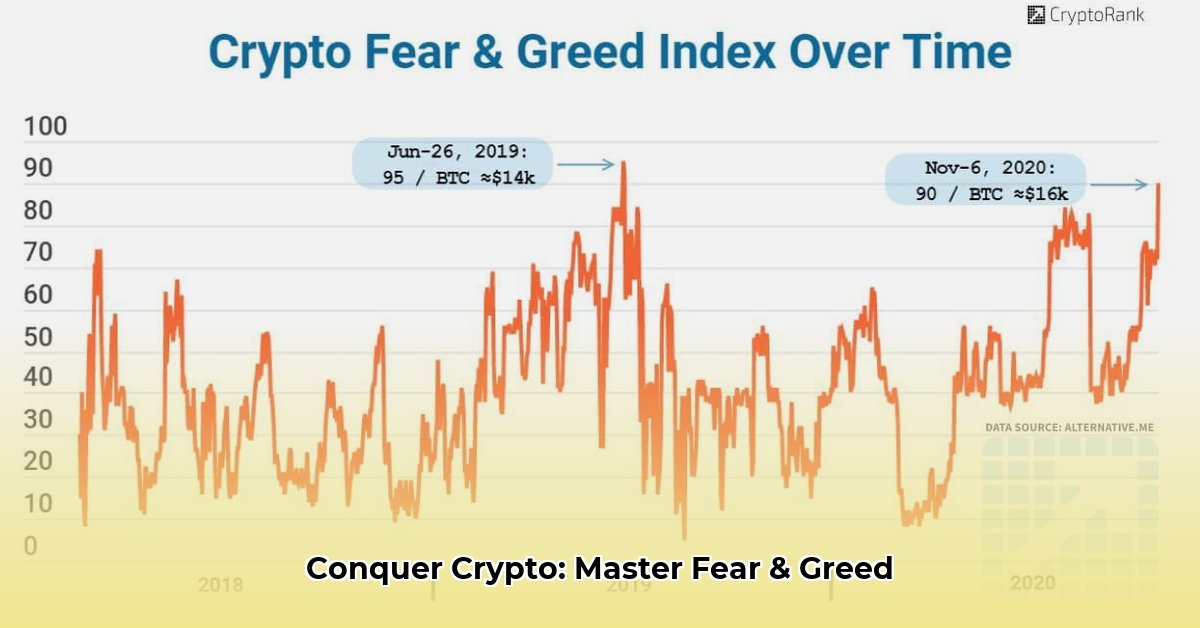
The crypto fear and greed index live isn’t a crystal ball, but a useful tool for understanding the overall market vibe. Data is combined to provide a single number, between 0 and 100, which indicates whether investors are feeling optimistic (greedy) or pessimistic (fearful). A low number suggests fear, while a high number indicates greed. But how accurate is this “mood meter,” really?
The Crypto Fear & Greed Index (FGI) offers a snapshot of market sentiment, but its predictive power is debated.
It synthesizes various market indicators to gauge investor sentiment, using a 0-100 scale (0 = extreme fear, 100 = extreme greed).
Combining the FGI with technical analysis, on-chain data, and macroeconomic factors sharpens trading decisions.
Decoding the Crypto Fear and Greed Index Live: How It Works
Different companies create their own crypto fear and greed index live, each with unique formulas for calculation. This can lead to slightly different numbers from various sources. One index might focus more on social media chatter, while another might weigh price changes more heavily. It’s important to research the methodology of each index you choose to follow.
It’s like measuring temperature – one thermometer uses Fahrenheit, the other Celsius. They measure the same thing but give you different numbers.
Here’s a simplified explanation of the common factors used:
Data Point
What it tells us
Price Volatility
How much the cryptocurrency prices jump around – big swings suggest uncertainty.
Market Momentum
The general trend of price movement; is the price going up or down strongly?
Social Media Sentiment
What people are saying about crypto on platforms like Twitter, Reddit, and Telegram.
Bitcoin Market Dominance
How much of the total crypto market is made up of Bitcoin.
Google Trends
Search queries related to Bitcoin and other cryptocurrencies.
Derivatives Markets
Analyzing data from options and futures markets, specifically put/call ratios.
Investor Surveys
Direct input from various investor groups about their feelings towards the market.
Stablecoin Flows
Monitoring the inflow and outflow of stablecoins to exchanges.
Reading the Tea Leaves: Interpreting the Crypto Fear and Greed Index Live
Generally, a score above 75 suggests extreme greed, meaning prices are likely inflated and a potential bubble may form. Conversely, scores below 25 point to extreme pessimism (fear) – this means the market might be oversold.
It’s crucial to remember though, this index is just one piece of the puzzle. Don’t solely rely on it to make your investment choices. Consider it a supplementary tool to enhance your overall analysis.
The Index’s Limitations: Understanding Market Bias
While the crypto fear and greed index offers valuable insights, it has limitations. It’s usually a “lagging” indicator, reflecting past sentiment rather than predicting the future. There’s no single, universally accepted way to construct these indices – different indexes give different readings. The unpredictable behavior of individual investors, often driven by emotions, makes precise predictions exceptionally difficult. Additionally, external events like regulatory announcements or major news stories can cause sudden shifts in sentiment that the index may not immediately reflect.
Ongoing research explores the influence of sophisticated trading bots and algorithms on the index’s reliability, which could impact future calculations. Algorithmic trading can amplify market movements, potentially skewing sentiment readings.
Putting the Index to Work: Actionable Steps for Investors
To use the index effectively:
Don’t rely solely on the index: Combine the index’s insights with other analytical tools like examining price charts (technical analysis), assessing the underlying value of projects (fundamental analysis), monitoring on-chain metrics, and keeping track of macroeconomic events.
Be aware of its flaws: The index isn’t foolproof. Acknowledge its inherent shortcomings and limitations. It is a snapshot in time, not a crystal ball for the future. Consider it as one data point among many.
Manage your risks: Diversify your investments across several different cryptocurrencies and other asset classes. Never invest more than you can comfortably afford to lose. Implement stop-loss orders to limit potential losses.
Stay in the know: Keep abreast of market developments and any regulatory changes. These can significantly sway market sentiment. Follow reliable news sources and industry analysts for up-to-date information.
Develop a comprehensive strategy: Integrate the index into your overall investment strategy – it’s a tool, not a magic solution. Define your investment goals, risk tolerance, and time horizon before making any decisions.
Consider Dollar-Cost Averaging (DCA): During times of extreme fear, consider employing a DCA strategy, buying small amounts of your chosen assets at regular intervals.
Review Historical Data: Analyze how the index has performed during past market cycles. This can provide context for current readings and inform future investment decisions.
Weighing the Pros and Cons: Is the Index Worth Using?
Pros:
Gives a quick overview of market sentiment at a glance.
Relatively easy to understand and use, even for newcomers.
Serves as a helpful addition to your investment decision-making process.
Provides a convenient summary of the current market mood.
Readily available from various sources, often free of charge.
Cons:
Not a precise predictor of future price movements; at best it offers a general sense of direction.
Different providers use varying methods, leading to inconsistent results.
Susceptible to manipulation and the influence of emotional biases.
A lagging indicator – it shows what happened, not what will happen.
Can be oversimplified, ignoring nuanced market dynamics.
In short: The crypto fear and greed index live is a useful tool, but not a magical solution. Wise investing means thorough research, careful risk management, and spreading your investments across various options. Use the index smartly, as one piece of a larger strategy, while analyzing Bitcoin Market Dominance.
How to Compare Different Crypto Fear and Greed Index Methodologies
The Crypto Fear & Greed Index (FGI) provides a sentiment snapshot, but its predictive power is debated. Different providers use varying methodologies and weighting schemes, leading to discrepancies. Understanding these variations is crucial for effective interpretation and informed decision-making. The index works best when used with other analytical tools. Extreme fear or greed levels may signal potential opportunities, but caution advised.
Decoding the Crypto Fear & Greed Index: A Multi-Faceted Tool
The Crypto Fear & Greed Index isn’t a crystal ball, but it’s a valuable tool. It synthesizes various market indicators to gauge investor sentiment, using a 0-100 scale (0 = extreme fear, 100 = extreme greed). Think of it as a market mood ring, though a much more data-driven one. But, how reliable is this “mood ring”?
The Problem of Methodology: Why aren’t all FGIs Created Equal?
While all FGIs aim to measure the same thing – market sentiment – their approaches differ. That’s where how to compare different Crypto Fear and Greed Index methodologies becomes vital. They might weight metrics differently. For instance, one index might heavily emphasize volatility, while another gives more importance to social media sentiment. Some may incorporate data from derivatives markets, while others might focus solely on spot market activity. This leads to different scores, even for the same market conditions. Imagine two weathermen looking at the same storm; one might emphasize wind speed, the other, barometric pressure, leading to different storm descriptions.
Dissecting the Components: What to Look For in Trading Volume
To effectively compare FGIs, analyze their components:
Volatility: How much does the price fluctuate? High volatility often indicates fear or greed. Is the volatility measured using historical data or implied volatility from options markets?
Trading Volume: High volume can suggest strong emotions; it’s not just about price, it’s the momentum. Is the volume measured across all exchanges or a select few?
Social Media Sentiment: What are people saying online? Are they bullish or bearish? A significant piece of the puzzle. Which platforms are being monitored – Twitter, Reddit, Telegram, or others?
Bitcoin Dominance: Bitcoin’s performance often influences the whole crypto market. Is Bitcoin leading the charge, or is it lagging? How is dominance calculated?
Google Trends: What search terms are being analyzed? Are they relevant and up-to-date?
Derivatives Markets: Is data from options and futures markets included? What specific metrics are being used, such as
Hello, My love for writing is rivaled only by my passion for in-depth research. While many may skim the surface, I dive deep, seeking the hidden gems of information that give a story texture and depth. Every word I write is backed by hours of exploration, ensuring that my work is not just compelling, but also meticulously accurate. Join me on a journey where every piece is a deep dive into the realms of knowledge and storytelling.