The world of crypto trading can feel like an untamed frontier, a landscape where fortunes are made and lost in the blink of an eye. The inherent volatility of digital assets often leaves traders feeling overwhelmed and uncertain. But what if there was a roadmap, a scientific approach to navigate these turbulent waters and potentially unlock significant profits? That roadmap is technical analysis.
This comprehensive guide will demystify the art and science of technical analysis for cryptocurrency trading, transforming raw crypto quotes into actionable insights. We’ll delve into the secrets of chart patterns, indicators, and advanced strategies, providing you with a superior framework to dominate your crypto trading journey. Whether you’re a beginner seeking a clear path or an experienced trader looking to refine your edge, mastering TA for crypto will empower you to make more informed, confident, and potentially profitable decisions.
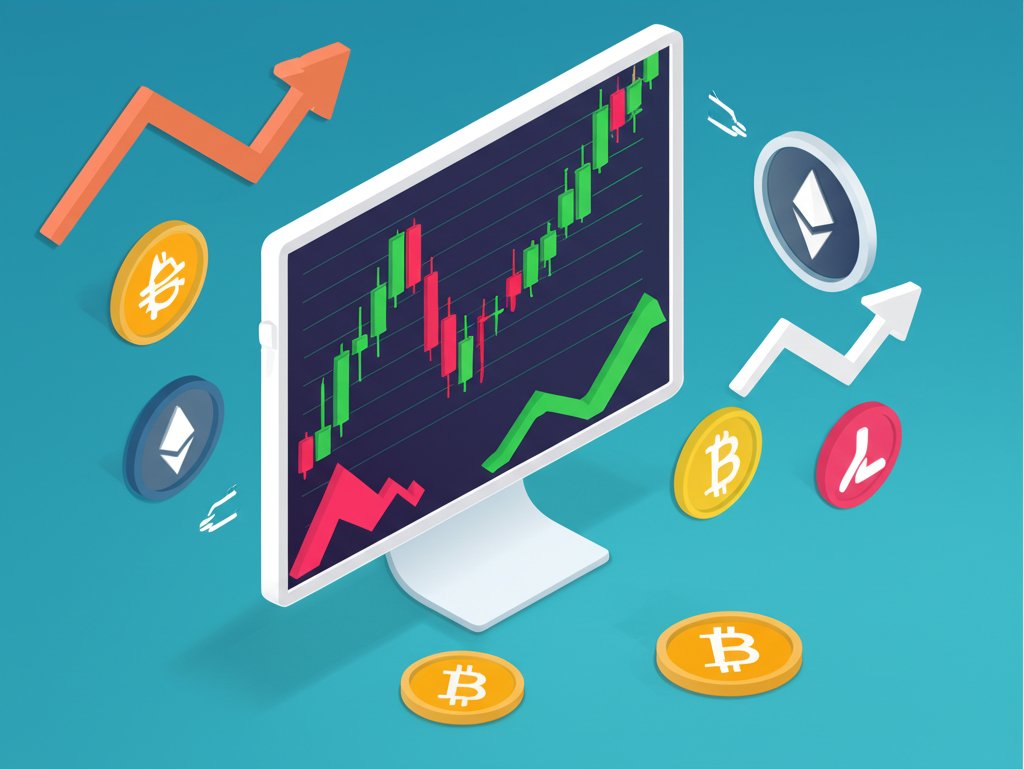
Decoding the Crypto Market: The Power of Technical Analysis (TA for Crypto)
Before diving into technical analysis, it’s crucial to grasp the basics of interpreting market data, so be sure you’re familiar with how to read and understand cryptocurrency quotes, which form the foundation of all TA efforts.

Imagine predicting market movements without needing to understand complex technologies or the latest news headlines. That’s the promise of technical analysis, a powerful methodology that focuses on studying historical price and volume data to forecast future price action. For the fast-paced world of digital assets, TA for crypto is an indispensable skill.
What is Technical Analysis and Why it Matters for Crypto?
Technical analysis is the study of past market data, primarily price and volume, to identify patterns and predict future price movements. Unlike fundamental analysis, which examines a project’s underlying value, TA assumes that all relevant information is already reflected in the asset’s price. For cryptocurrency trading, where news can spread instantly and sentiment shifts rapidly, TA offers a structured way to interpret collective market psychology.
The crypto market’s extreme volatility makes TA particularly potent. Price movements can be swift and dramatic, often forming clear, repeating patterns that experienced traders can capitalize on. By understanding these patterns and the signals from various indicators, traders can gain an edge, identifying potential entry and exit points with greater precision.
The Core Principles Guiding TA in Volatile Markets
At its heart, technical analysis for crypto trading rests on three fundamental principles:
- Market Action Discounts Everything: This means that all factors influencing an asset’s price – economic data, company news, geopolitical events, and even investor sentiment – are already priced into the market. Therefore, by analyzing price action, you are implicitly analyzing all these factors.
- Prices Move in Trends: Crypto markets, like traditional markets, tend to move in identifiable trends – uptrends, downtrends, or sideways (consolidation) trends. The primary goal of TA is to identify these trends early and trade with them. “The trend is your friend” is a classic adage for a reason.
- History Repeats Itself: Human psychology, which drives market participants, tends to react similarly under similar circumstances. This leads to recurring price patterns and cycles. Technical analysis seeks to identify these historical patterns, believing that they offer clues about future behavior.
These principles form the bedrock upon which all TA for crypto strategies are built, offering a structured approach to a seemingly chaotic market.
Essential Tools for Profitable Crypto Trading: Key Indicators & Patterns
To truly excel in profit crypto trading, you need to equip yourself with the right tools. This section will guide you through the foundational indicators and chart patterns that serve as the backbone of effective technical analysis.
Mastering Candlestick Charts: The Visual Language of Price Action
Candlestick charts are the most popular and informative way to visualize crypto quotes over time. Each “candle” represents the price action for a specific period (e.g., 1 hour, 1 day, 1 week), providing a snapshot of opening, closing, high, and low prices.
- The Body: The wide part of the candle shows the range between the opening and closing price.
- Green/Bullish Candle: The closing price was higher than the opening price, indicating buying pressure.
- Red/Bearish Candle: The closing price was lower than the opening price, indicating selling pressure.
- The Wicks (Shadows): The thin lines extending from the body represent the highest and lowest prices reached during that period.
- A long upper wick suggests buyers drove prices up, but sellers pushed them back down before closing.
- A long lower wick suggests sellers drove prices down, but buyers pushed them back up before closing.
Learning to interpret individual candlesticks and candlestick patterns (like Dojis, Hammers, Engulfing patterns) can provide early signals of trend reversals or continuations in cryptocurrency trading.
Foundation Indicators: Moving Averages, RSI, and MACD
These three indicators are the workhorses of technical analysis and are essential for any profitable crypto trading strategy.
Moving Averages (MA): Identifying Trends
Moving Averages smooth out price data over a specified period, making it easier to identify the underlying trend.
How to Use:
Relative Strength Index (RSI): Spotting Overbought/Oversold Conditions
The RSI is a momentum oscillator that measures the speed and change of price movements. Its value ranges from 0 to 100.
How to Use:
Moving Average Convergence Divergence (MACD): Uncovering Momentum Shifts
The MACD is a trend-following momentum indicator that shows the relationship between two moving averages of an asset’s price. It consists of the MACD line, the signal line, and the histogram.
How to Use:
Chart Patterns: Recognizing Market Psychology
Beyond individual candlesticks and indicators, recurring chart patterns reveal shifts in supply and demand, often signaling potential future price movements in cryptocurrency trading.
Reversal Patterns
- Head and Shoulders (and Inverse): A classic top (bearish reversal) or bottom (bullish reversal) pattern. It signals a strong trend exhaustion.
- Double Top/Bottom: Two peaks (bearish) or two troughs (bullish) at roughly the same price level, indicating strong resistance or support, followed by a reversal.
Continuation Patterns
- Triangles (Symmetrical, Ascending, Descending): Prices consolidating within converging trendlines, often preceding a breakout in the direction of the prior trend.
- Flags & Pennants: Short-term consolidation patterns that resemble flags or pennants, typically occurring after a sharp price move and indicating a continuation of that move.
Volume Analysis: Confirming Price Movements
Volume represents the number of units of a cryptocurrency traded over a specific period. It’s a crucial confirmatory indicator for technical analysis.
How to Use:
From Crypto Quotes to Confident Decisions: A Step-by-Step TA Strategy
Turning raw crypto quotes into profitable trading decisions requires a systematic approach. This step-by-step guide will walk you through a robust TA for crypto strategy, helping you integrate the tools and principles discussed.
Step 1: Setting Up Your Chart & Data Source (Understanding Crypto Quotes)
Before anything else, you need reliable crypto quotes displayed on a charting platform (e.g., TradingView, your exchange’s built-in charts).
Step 2: Identifying the Dominant Trend Across Timeframes
- Macro Trend (Higher Timeframe): Start by looking at a longer timeframe (e.g., daily or weekly chart) to identify the overarching trend. Is the asset in an uptrend, downtrend, or sideways consolidation? This gives you the “big picture” context.
- Micro Trend (Lower Timeframe): Then, switch to your primary trading timeframe (e.g., 4-hour or 1-hour chart). How does the current price action relate to the macro trend? Are you seeing a minor correction within a larger uptrend, or a reversal? Always aim to trade with the higher-timeframe trend.
Step 3: Applying Indicators for Confirmation & Entry/Exit Signals
Once the trend is identified, add your chosen indicators (MA, RSI, MACD, etc.) to your chart.
Buy Signal: Price bounces off MA support, MACD bullish crossover, RSI exits oversold territory, strong bullish candlestick pattern on rising volume.
Sell Signal: Price rejects MA resistance, MACD bearish crossover, RSI exits overbought territory, strong bearish candlestick pattern on rising volume.
Step 4: Recognizing & Validating Chart Patterns
Keep an eye out for common chart patterns.
Step 5: Integrating Fundamental Analysis (Briefly, as context)
While technical analysis focuses on price, it’s always wise to have a basic understanding of the asset’s fundamentals.
Advanced Technical Analysis for Cryptocurrency Trading Mastery
Once you’ve mastered the basics, diving into more advanced technical analysis techniques can provide an even deeper edge in cryptocurrency trading. These methods offer additional layers of confirmation and insight.
Bollinger Bands & Ichimoku Cloud: Unveiling Volatility and Future Support/Resistance
Bollinger Bands (BB)
Bollinger Bands consist of a simple moving average (the middle band) and two outer bands (typically two standard deviations away from the SMA).
How to Use:
Ichimoku Cloud (Ichimoku Kinko Hyo)
The Ichimoku Cloud is a comprehensive indicator that provides support and resistance levels, trend direction, and momentum. It’s a visual forecast of future price movements.
How to Use:
Fibonacci Retracements & Extensions: Pinpointing Price Targets
Fibonacci tools are based on the mathematical Fibonacci sequence and are used to identify potential support and resistance levels.
How to Use:
Elliott Wave Theory & Supply/Demand Zones: Deeper Market Structure
Elliott Wave Theory
This theory suggests that market prices move in distinguishable patterns, or “waves,” driven by investor psychology. It posits that markets follow a 5-wave impulse pattern in the direction of the main trend, followed by a 3-wave corrective pattern against the trend.
How to Use: Identifying these waves can help anticipate larger trend reversals or continuations, though it requires significant practice and is highly subjective.
Supply/Demand Zones
These are price ranges on a chart where buyers (demand) or sellers (supply) have previously entered the market in such force that they caused a significant price reversal.
How to Use: These zones act as powerful areas where price is likely to find support (demand zone) or resistance (supply zone), offering high-probability entry or exit points for your TA for crypto strategies.
Algorithmic Trading & Automation: Leveraging TA for Efficiency
For those comfortable with coding or using advanced platforms, implementing technical analysis through algorithmic trading can enhance efficiency.
How to Use:
Critical Risk Management in Crypto Trading: Protecting Your Capital
Even with the best technical analysis, risk management is the single most important factor for long-term success in profit crypto trading. The highly volatile nature of cryptocurrency trading makes this even more crucial.
Defining Your Risk Tolerance & Position Sizing
Before any trade, you must know how much you are willing to lose.
Implementing Stop-Loss and Take-Profit Orders
These are your primary tools for managing risk and locking in profits.
Diversification and Portfolio Rebalancing
- Diversify: Don’t put all your capital into a single cryptocurrency. Spread your investments across several assets, focusing on different sectors or use cases, to mitigate the impact of any one asset’s poor performance.
- Rebalance: Periodically review your portfolio. If one asset performs exceptionally well, it might grow to an oversized portion of your portfolio. Sell some of it to bring your allocation back to your target percentages, and reallocate to underperforming (but still fundamentally strong) assets.
The Importance of Journaling and Backtesting Your TA Strategies
- Trading Journal: Keep a detailed record of every trade – the asset, entry/exit prices, reasons for the trade (based on your technical analysis), indicators used, and the outcome. This helps you identify what works and what doesn’t, allowing for continuous improvement.
- Backtesting: Before risking real capital, test your TA for crypto strategies against historical data. This helps you understand the strategy’s potential profitability, drawdown, and win rate. Refine your rules until you have a robust, data-backed approach.
Conclusion: Mastering Technical Analysis for Sustainable Crypto Trading Profit
The quest for profit crypto trading doesn’t have to be a gamble. By mastering the secrets of technical analysis, you gain a profound understanding of market dynamics, transforming chaotic crypto quotes into clear signals. We’ve journeyed from fundamental concepts like candlestick charts and essential indicators (Moving Averages, RSI, MACD) to advanced techniques such as Bollinger Bands, Ichimoku Cloud, and Fibonacci levels, all designed to sharpen your cryptocurrency trading edge.
Remember, however, that TA for crypto is a powerful tool, not a crystal ball. Its effectiveness is amplified when paired with disciplined risk management, continuous learning, and adaptability to ever-evolving market conditions. Embrace the step-by-step strategy, practice consistently, and never stop refining your approach. The keys to confident and potentially profitable crypto trading are now firmly in your hands.
FAQ: Your Top Questions About Crypti Trading and Technical Analysis Answered

Is technical analysis reliable for crypto?
Yes, technical analysis is widely considered reliable for crypto trading, perhaps even more so due to the market’s high volatility and the tendency for clear patterns to emerge from collective trader psychology. However, it’s not foolproof and should be combined with robust risk management.
What are the best indicators for TA for crypto beginners?
For beginners, the most effective indicators for TA for crypto are:
How often should I check crypto quotes?
The frequency of checking crypto quotes depends on your trading style. Day traders might check every few minutes, swing traders every few hours to daily, and long-term investors daily to weekly. Over-monitoring can lead to emotional trading, so stick to your chosen timeframe.
Can I use technical analysis for long-term cryptocurrency trading?
Absolutely. While often associated with short-term strategies, technical analysis is highly effective for long-term cryptocurrency trading. By analyzing daily, weekly, and monthly charts, you can identify major trends, key support/resistance levels, and optimal entry/exit points for long-term positions, often in conjunction with fundamental analysis.
What’s the biggest mistake in crypto trading using TA?
The biggest mistake in crypto trading using technical analysis is ignoring risk management. Even the most accurate TA signal can result in losses if position sizing is too large or stop-loss orders aren’t used. Over-reliance on a single indicator or failing to adapt strategies to changing market conditions are also common pitfalls.